Irene V. Hylton Planetarium: Service Modernization
Service redesign and website modernization for a public-school planetarium, improving program discovery, show visibility, and booking workflows within district constraints.
Overview
The Irene V. Hylton Planetarium is part of Prince William County Public Schools and serves both public audiences and K–12 educators booking class visits. The digital experience and booking journey previously relied heavily on manual coordination and limited visibility into show offerings.
I led a full modernization effort spanning service design, content strategy, brand refresh, and website redevelopment. We restructured programs and shows into clear, searchable categories, refreshed photography and visual presentation, and rebuilt the website with a modern show-management and booking experience that improved visibility for both educators and the public.
A custom CMS was developed (implemented in WordPress by my designer/developer) to support show and content management. The booking platform had to operate within existing district constraints and integrations that could not be modernized (including district systems tied to meal-plan workflows).
In parallel, we produced supporting collateral (brochures and booklets) to reinforce the experience across physical and digital touchpoints.
Project Details
- role
- Product Manager & UX Director (Lead)
- timeline
- 6 months (phased delivery aligned to school-year launch)
- team
- Christina Alchus (PM & UX Director), Scott (Designer/Developer), Planetarium Director + District Stakeholders
- deliverables
- Service design, IA + content system, Website redesign, CMS specs, UX prototypes, Brand refresh, Marketing collateral
- tools
- Figma, Adobe Creative Suite, WordPress, Custom CMS
What I Led
Product + UX Leadership across strategy, execution, and delivery
Product Direction & Concept Framing
Led discovery and defined the overall plan, concepts, and proposed solutions end-to-end.
Service Design
Mapped and redesigned the full educator + public journey (discovery → selection → booking → arrival flow), reducing operational friction.
Workflow & UX Design
Designed the booking and show-management workflows, information architecture, and interaction model.
Team Leadership
Led Scott (designer/developer) through design and build execution; ensured the build matched the UX intent and operational needs.
Content Strategy & Governance
Developed show/program categories, structured templates, and content standards to enable search and filtering.
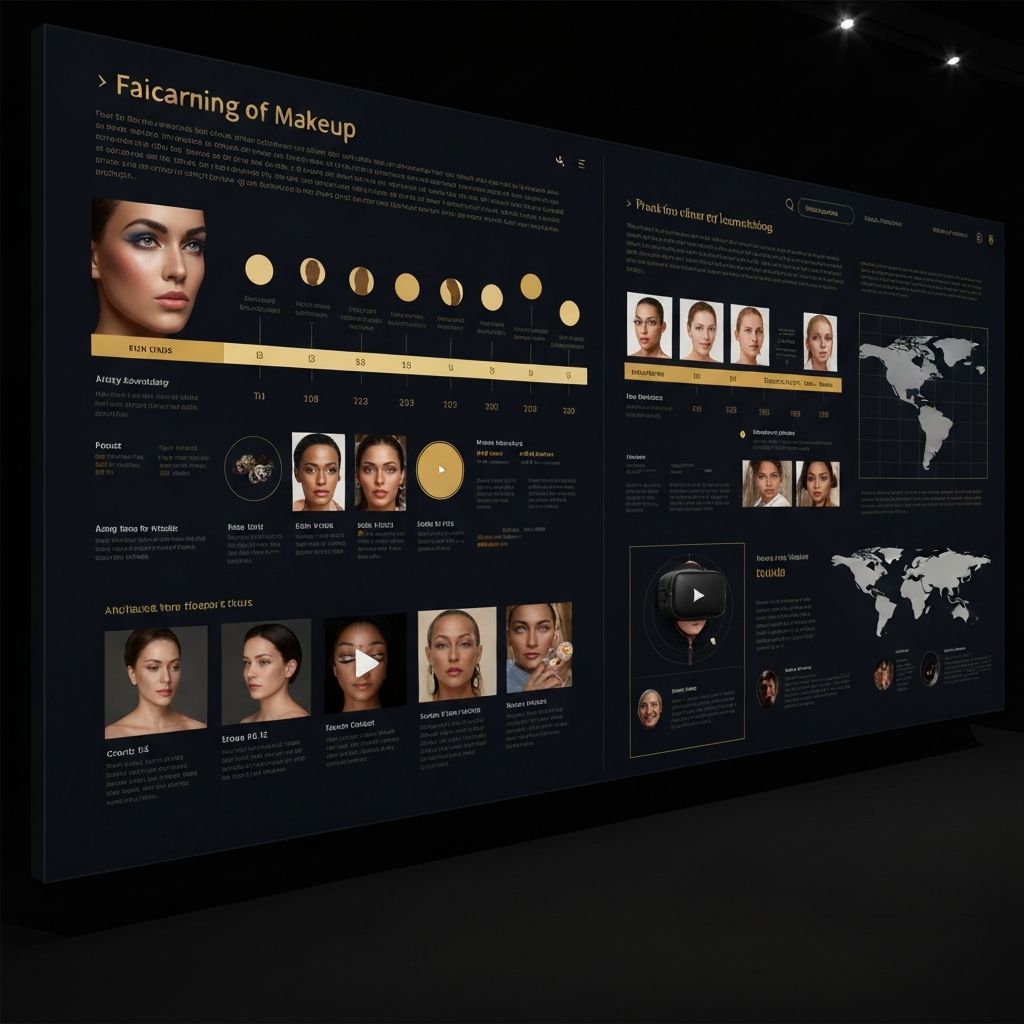
Brand/Visual Modernization
Directed refreshed photography usage and rebuilt the logo to remove pixelation from an older file.
Collateral System
Oversaw brochures and booklets to support educators and the public across channels.
Discovery
Stakeholder Engagement
Operational discovery sessions with planetarium leadership and district stakeholders to understand constraints and opportunities.
Current-State Review
Analysis of existing website/content structure and booking coordination pain points to identify improvement areas.
Iterative Prototyping
Figma-based prototyping to validate workflows before build, ensuring alignment between UX intent and technical implementation.
Define
Problem Synthesis
Booking Friction
Teachers relied on email and phone calls to book visits, creating administrative bottlenecks and scheduling conflicts.
Low Discoverability
Limited web presence meant educators couldn't easily find show availability or program options.
Manual Operations
Staff spent significant time managing bookings, confirmations, and patron communications via email.
User Stories
"Quickly see available dates and book a field trip for my class"
Calendar-centric booking flow with visual availability
"Manage show schedules and bookings without email back-and-forth"
Custom CMS with structured content and booking management
"Easily rebook a show I've attended before"
Quick actions dashboard with booking history access
Design
Mental Model Clusters
Task-Oriented Booking
Users think in terms of "Book a visit" → "Pick a date" → "Confirm details"
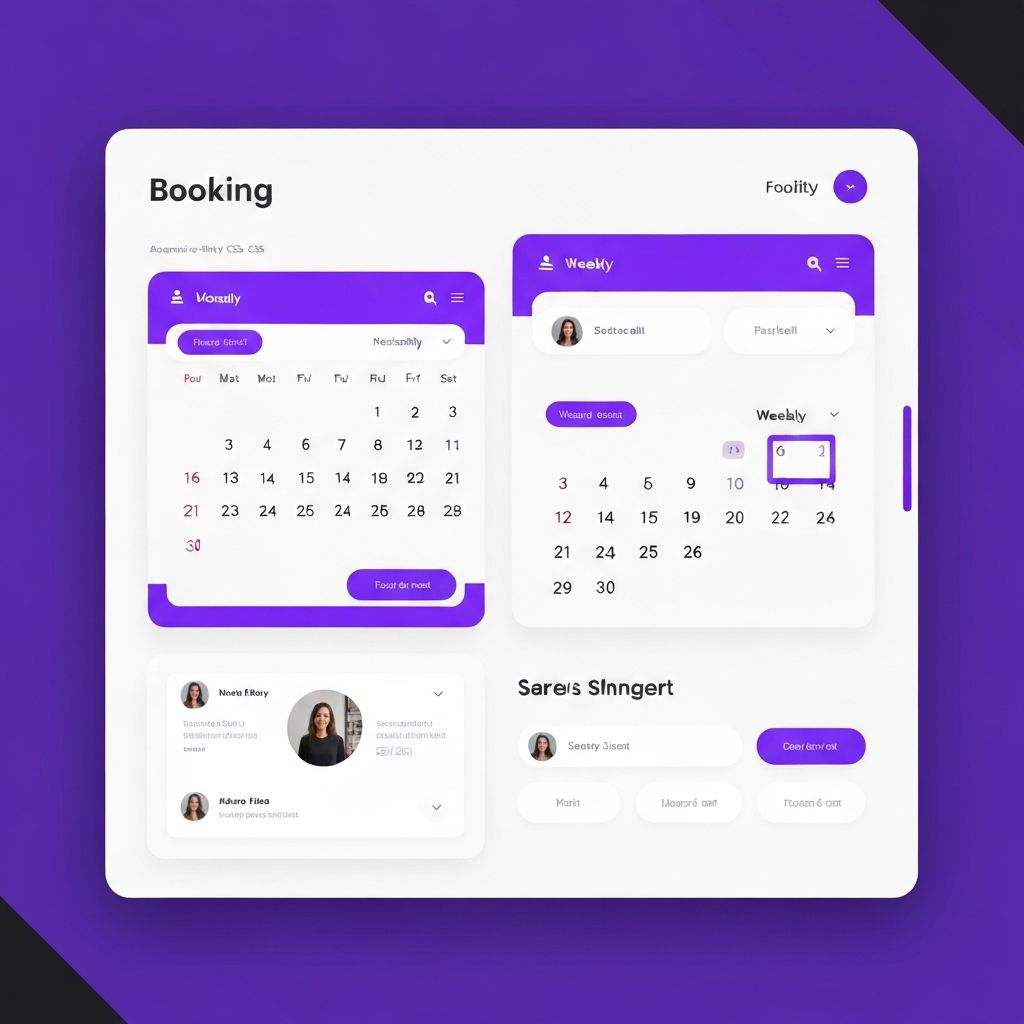
Calendar-Centric View
Educators prefer seeing availability first, then filtering by program type
History & Continuity
Repeat users want quick access to previous bookings and "book again" actions
Information Architecture Strategy
Calendar as Primary Navigation
Visual availability drives the booking flow
Progressive Disclosure
Show only relevant options at each step
Persistent Context
Maintain booking summary throughout flow
Quick Actions Hub
Dashboard with shortcuts for repeat users
Information Architecture Overview
Prototypes: Lo → Hi-Fi Evolution
Iterative design process from paper sketches to high-fidelity interactive prototypes
Lo-Fi Sketching Phase
Rapid exploration of layout concepts
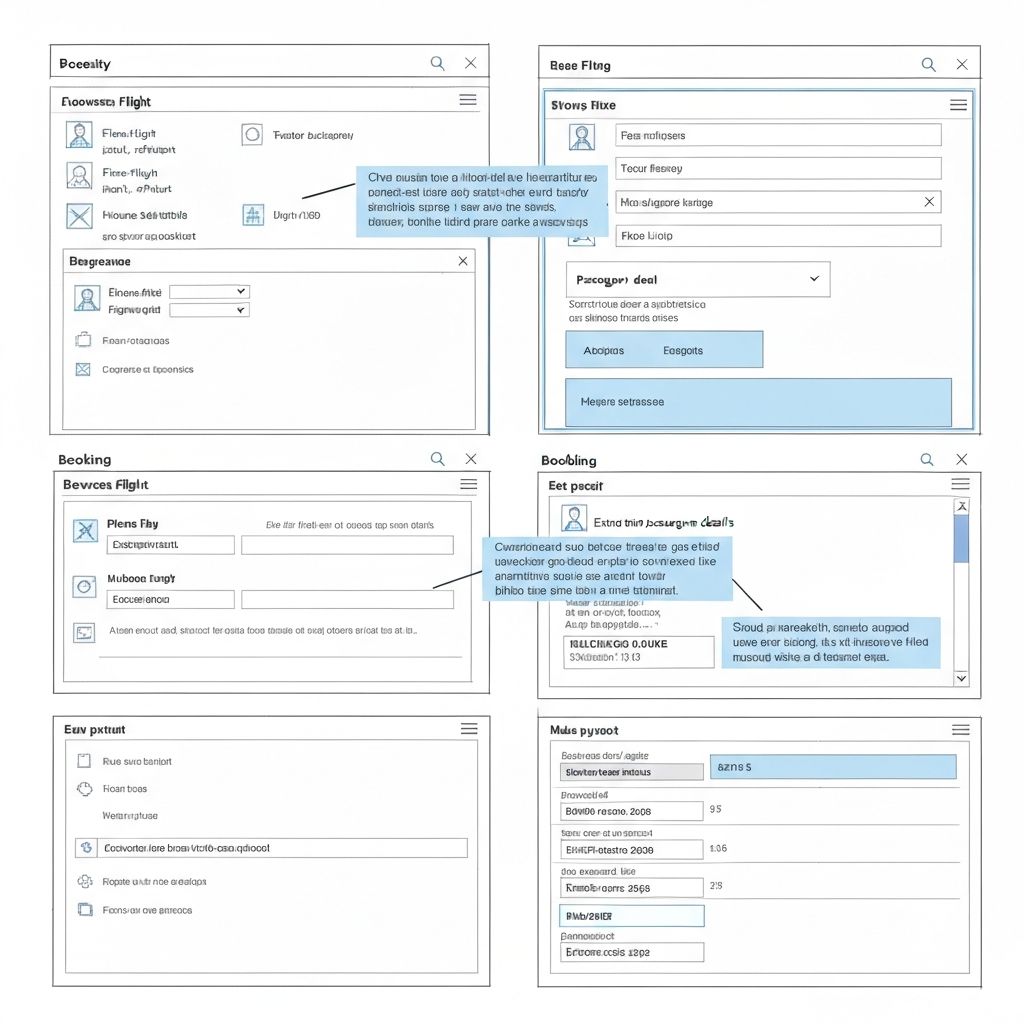
Hi-Fi Mockup Screens
Polished visual design with interactions
Design Evolution Timeline
Paper Prototypes
35 concepts explored
Digital Wireframes
12 key screens defined
Interactive Prototypes
3 usability test rounds
Hi-Fi Designs
Production-ready specs
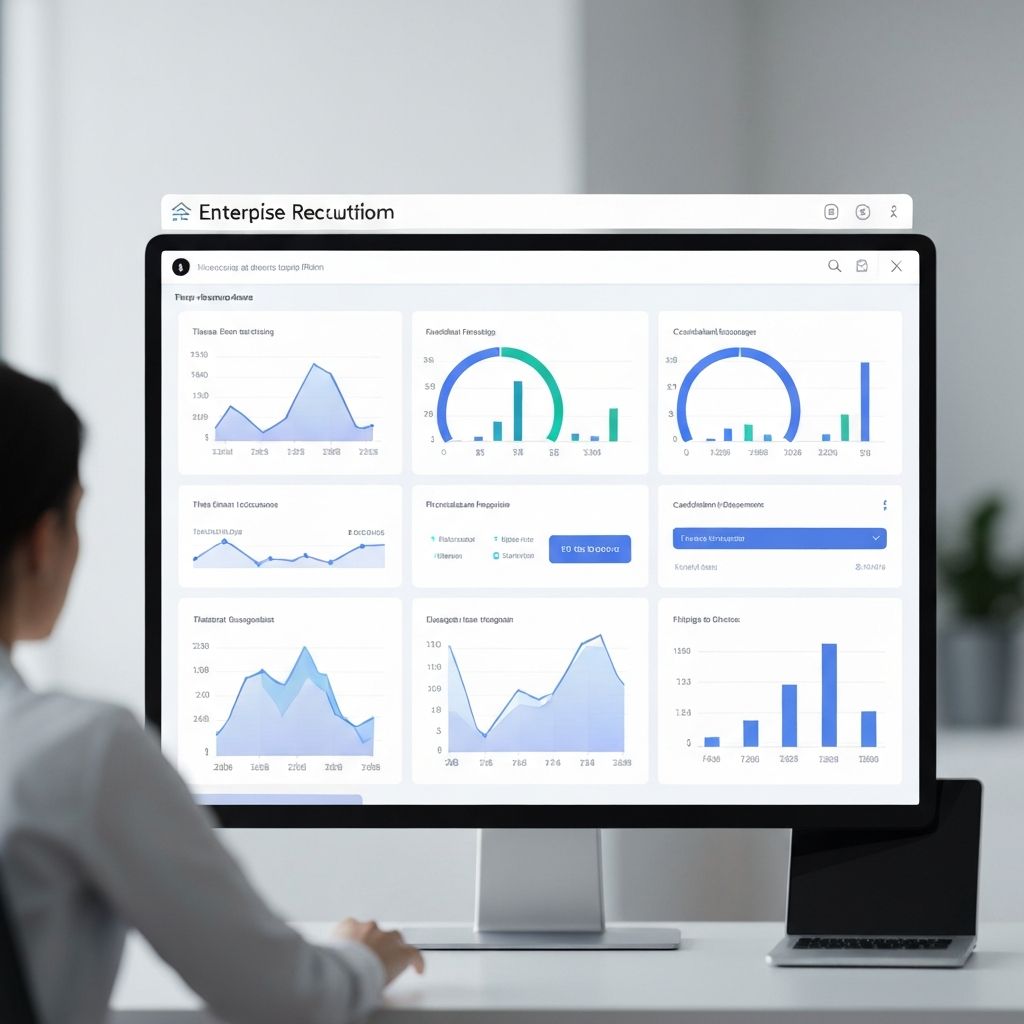
Deliver
430%
Web Traffic Increase
Visibility improvement
70%
Email Dependency Reduced
Booking communications
Key Outcomes
- Streamlined show management through a custom CMS and structured content categories
- Created public visibility into available shows and booking pathways that previously did not exist
- Increased web traffic by 430%
- Decreased email dependency for managing patrons and teachers booking class visits by 70%
- Set a modern standard others referenced (used as a model/benchmark for other planetariums)
Artifacts Gallery
Key deliverables from the project
UX Workflows & Prototypes
Figma
IA + Content Category Map
CMS Workflow Specs
Brand Assets
Logo rebuild + guidelines
Brochure + Booklet Samples
Related Case Studies
Explore similar projects demonstrating strategic design impact
Interested in Learning More?
Dive deeper into the process, explore additional artifacts, or discuss how these approaches can be applied to your challenges.